Sources (Data)
Our data consisted of over 3000 Carletonian issues from 1877-2025. We chose to use this data because we are interested in student reporting and trends surrounding that. We got the data from the Carleton College Archives. They were originally pdfs, but we obtained the .txt files to use for text analysis from the archivist David Bliss. We used text analysis to recognize and campus location mentions in our data.
Processes (Methods)
Because our dataset was so massive, we ran into quite a few challenges when it came to processing and visualizing it. Matilda started out by saving the ZIP file containing all the documents onto her computer, uploading the files into the domain of this website, then setting up a spreadsheet with each issue’s URL to upload into Voyant. However, this was too much data for Voyant to process all at once, so we had to explore other tools to create our main data visualization.
One tool we found was Google Colab, which we liked because it was a more beginner friendly version of Python, and easily accessible in a browser. Lily worked with Gemini to help craft code templates that would eventually help us create an Excel spreadsheet of each mention of a dorm building, its context, and its sentiment score over every issue of the Carletonian!
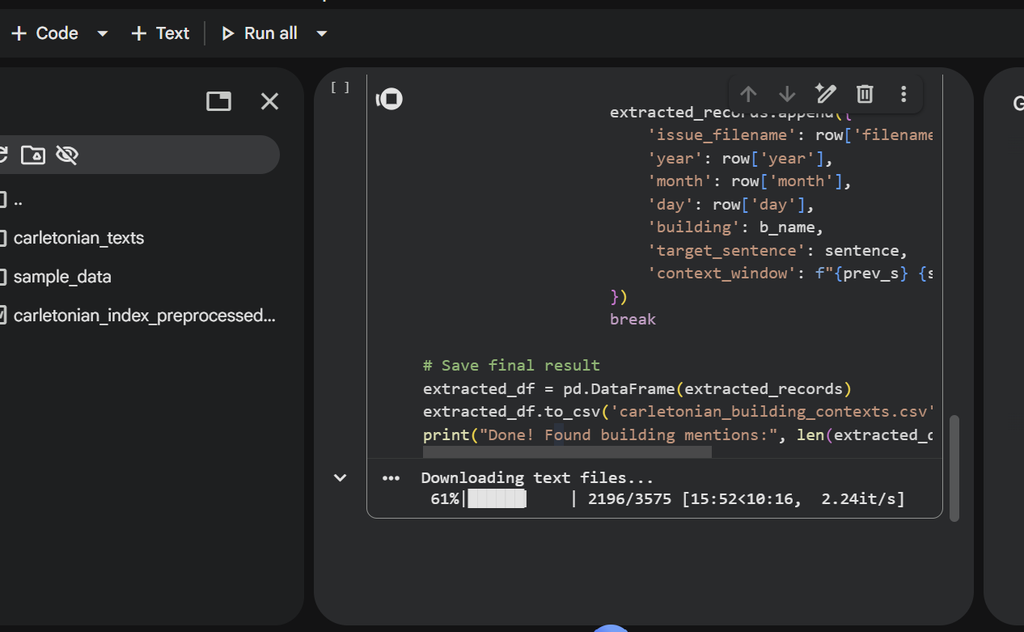
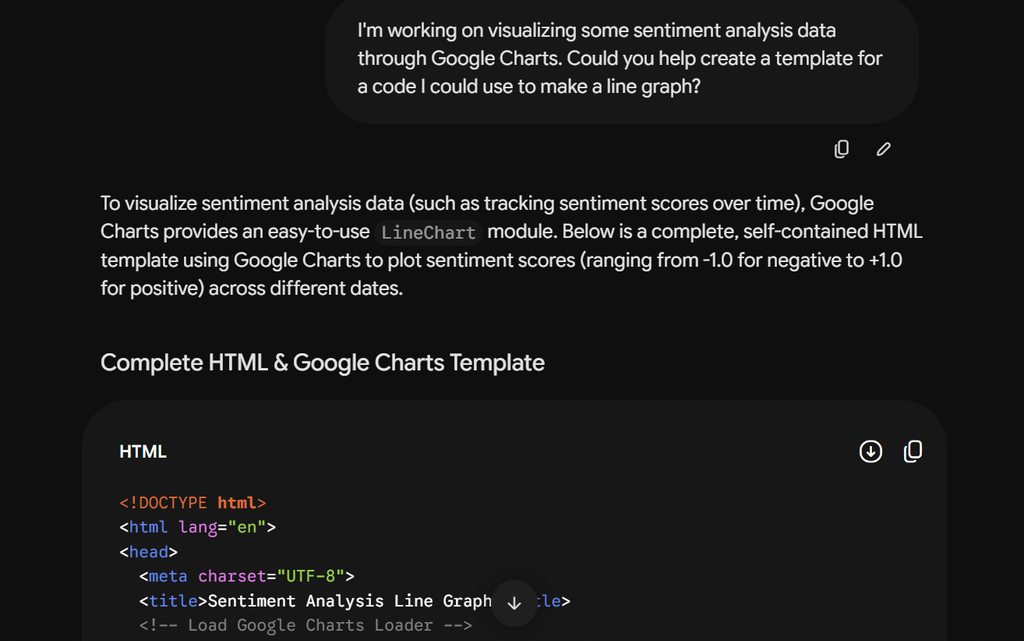
We then went to Google Charts to create an interactive line graph displaying this data—using a combination of the line graph tutorial available on the Charts website and Gemini’s templates, we were finally able to create a visualization we felt accurately conveyed the story we wanted to tell with our data.
Meanwhile, Mandy worked on a timeline where she visualized the actual history of when each building was built and (if applicable) torn down. Using Voyant, she compared this to the first time each building was mentioned in the Carletonian, allowing us—and you—to compare our data with Carleton’s actual history.
To embed our line graph visualization, we downloaded our graph as an HTML file and added it to the same folder as our CSV. After making last minute edits to our graph in Visual Studio Code, we emailed our big folder to our professor so he could upload it to the domain of our website. With this, we were able to embed our visualization into WordPress for you to examine.
Finally, we began identifying storytelling trends in our data we found especially interesting. If you haven’t already, you can read more about the specific things we found under our Narratives page.
Overall, we learned a lot about working with large datasets from this process, and the challenges that can arise! However, we persisted, and we feel much more knowledgeable about data visualization and how to overcome such challenges. Our problem-solving skills and teamwork helped us get through the most difficult parts of the process and create something we believe is worth sharing.
Presentation Choices (Platform and Audience
It was very hard to choose a way to visualize our data because was so huge in size! However, we decided a line graph would be the best way to convey our project’s narrative, as it displays the changes in each building’s sentiment scores over time in a way that is easy to navigate. We tried making our visualization as clear as possible by choosing to represent each building with a different color, as well as making the lines for each building toggleable, so viewers can choose to isolate different buildings and trends if they wish. If you hover over the points on the lines, a pop-up will appear containing the context the building was originally set in, so viewers can compare the sentiment score our code came up with against the actual context block from the Carletonian article.
As for our website, we designed it to look like that of a newspaper to fit our research subject, and made sure to include many visual/storytelling elements besides our main line graph—such as images and our timeline—to make our platform more engaging. We wanted it to be public so anyone can access our work. We intend our project to reach Carleton students, professors, and alumni who would like to see how dorm buildings are being written about over time, but also anyone who knows about the Carletonian and/or is interested in sentiment analysis, Carleton College’s history, and student journalism. Our hope is that our project can not only bring to light aspects of the history of Carleton’s residential buildings, but some of the changing attitudes people have had about them over the years through the College’s student journalists, past and present alike.