In order to produce information about trends in the content of the Carletonian, several steps were taken to access, process, and analyze the data. The flow of our work is as follows:
- Separating and downloading front pages
- Merging front pages into one document by year
- Extracting text from each combined document
- Uploading text into Voyant & performing various analyses
- Extracting data from Google Ngram Viewer to compare
- Visualizing textual and visual changes over time using Flourish, Time Graphs and iMovie
Separating and downloading first pages
The first, and most tedious task we faced was downloading each of the front pages of the Carletonian that we wanted to use. Upon exploring the digital collection of the newspapers, we found that the times per year that the Carletonian was published fluctuated heavily (we made a graph about that!). We also found it was a difficult process manually opening and downloading only the first page of each issue.
In order to avoid having heavy bias towards 1977, the year when the name was changed to “The Carleton Daily” and 78 issues were published as opposed to the regular 25-26, we made the decision to only use a sampling of the front pages: three per year, one from each of the the first issue published February, May, and October. We chose these months since they represent the middle month of each term, but we also recognize that this may create slight tendencies towards having month-specific events show up more commonly in our data, like May Fete and Winter Carnival.
With our decision to use three front pages per year, we also had to limit the years we focused on. Issues from 1877-2019 are available in the digital collection, but from 1877 to 1882, there were less than three Carletonian issues published per year, leaving us with insufficient data for those years. So, we decided to start all of our analyses in the year 1883, the first year that had enough front pages for us to use.
Merging front pages into one document by year
We needed a streamlined way to extract and organize the text from the PDFs for use in textual analysis software like Voyant. We reached out to reference librarian Sarah Calhoun and she initially suggested the low-tech method of copying and pasting text from each PDF but also referred us to David Bliss, Carleton’s Digital Archivist. He was a great resource given his intimate knowledge of the Carletonian Collection in the archives, having worked with them more than nearly anyone else on campus.
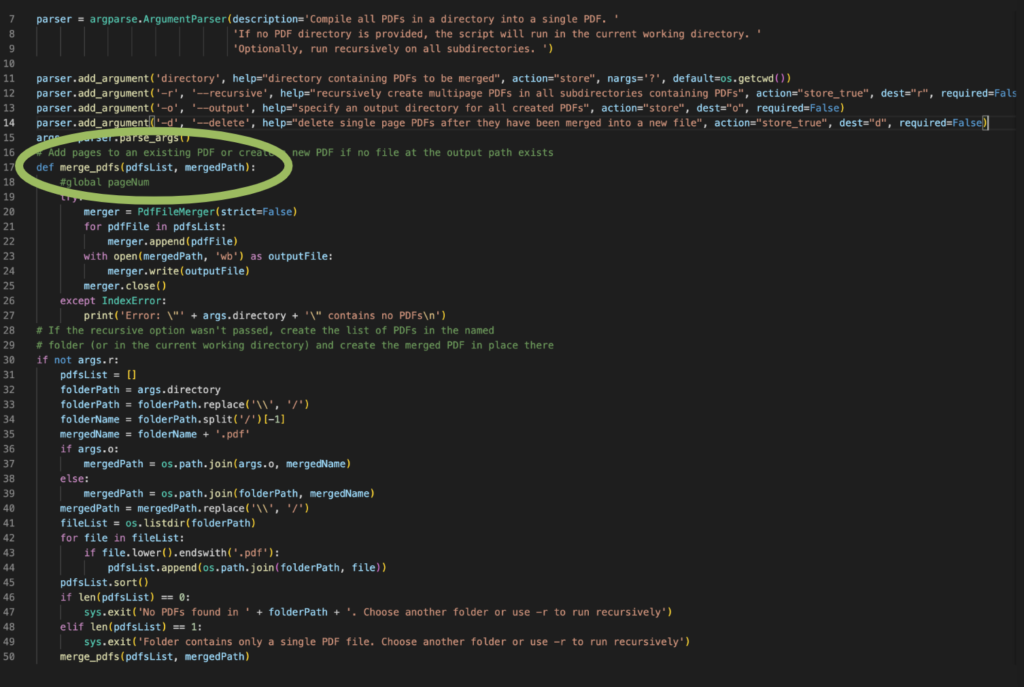
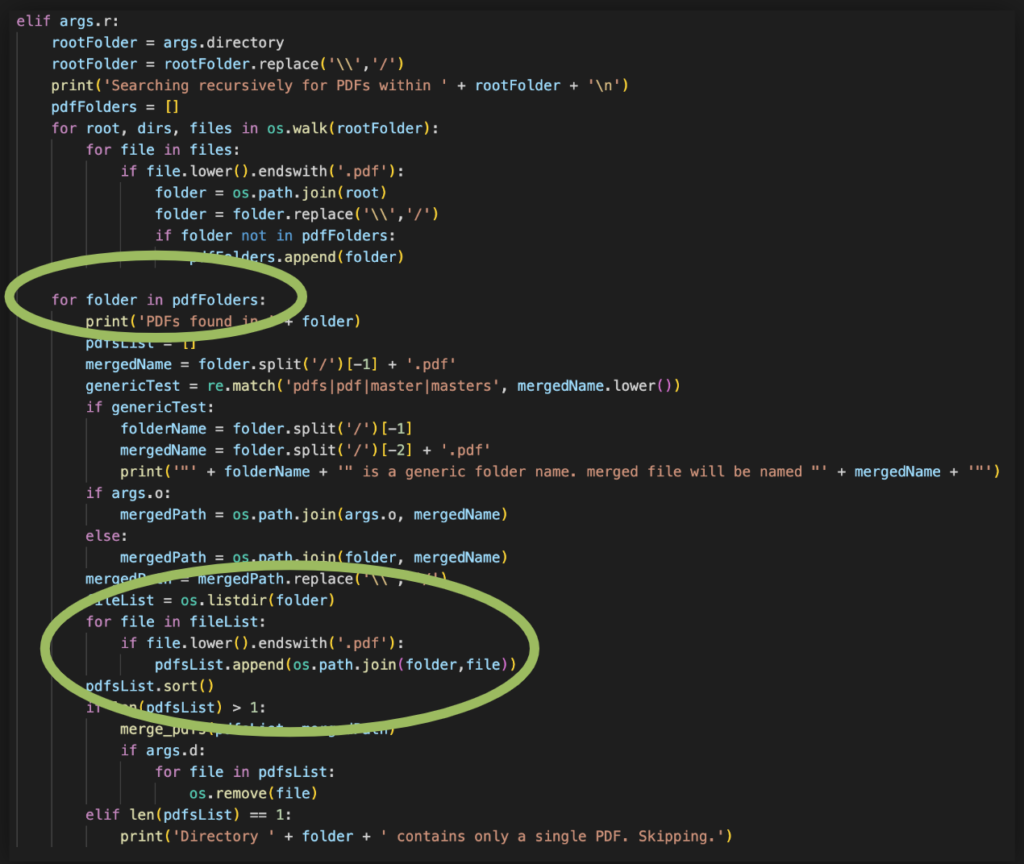
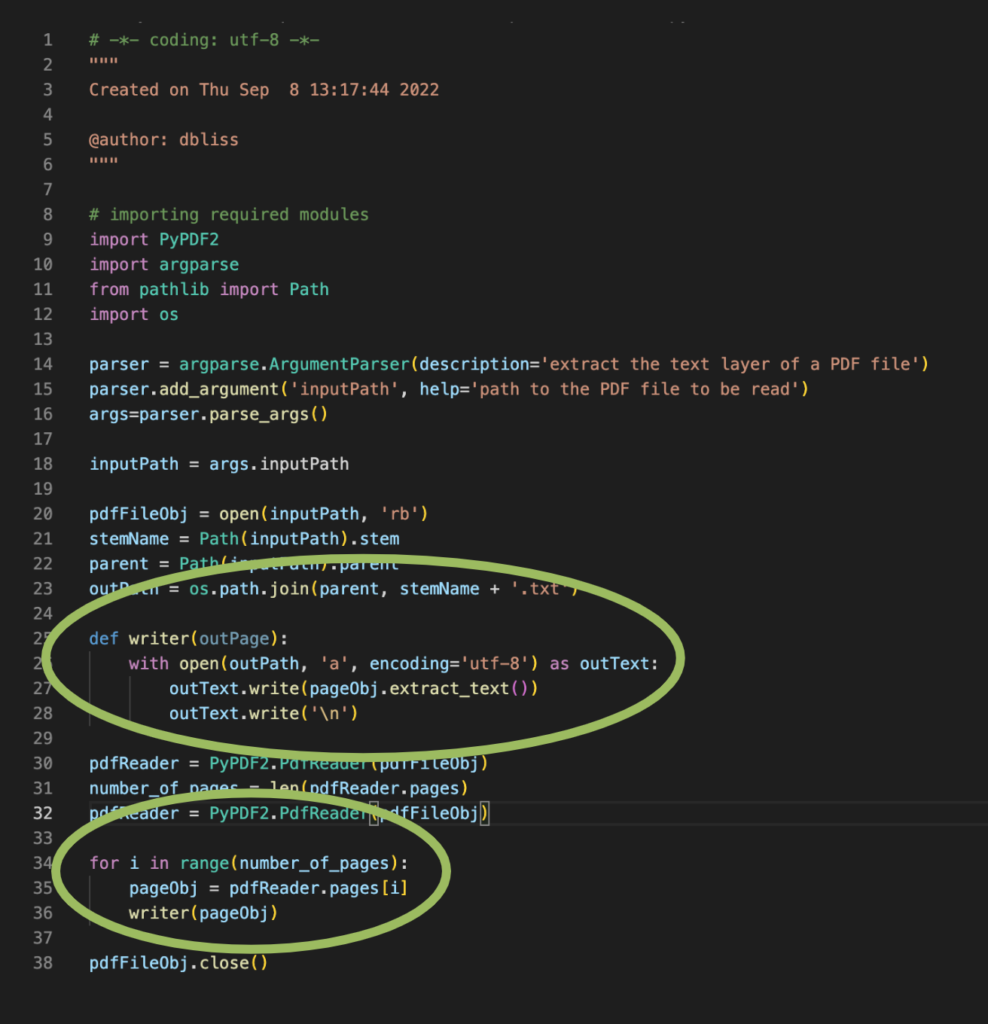
When the newspapers were first put in the Digital Archives, they had been put through Optical Character Recognition (OCR) software to identify the text on the pages, so all we needed to do was extract the existing text layer from each page that we had downloaded. David had two Python scripts that he had use for this purpose: one to merge PDFs by folder so that we could perform analyses by year, and the other to extract the text layer from our merged PDFs.
Extracting text from each combined document
Uploading text into Voyant & performing various analyses
Now that we had a plaintext file containing the text from each year of sampled front pages, we were able to upload it to Voyant, which was our primary tool for text analysis. In Voyant, we had to make choices about the words we wanted on our stoplist- words that are to be excluded from tables and visualizations. Voyant automatically creates a stoplist that includes symbols, single letters, and very short common words, like “the”. We found several additional things we wanted to add to our stoplist, including OCR errors like incomplete words that appeared frequently, and frequent but uninteresting words to us, like Carleton.
We primarily used Voyant’s features to calculate cumulative frequency of all words in the corpus, and to calculate the frequency of certain words over time. Voyant was a helpful tool for finding meaningful trends in our jumble of thousands of words; Voyant also creates miniature graphs for word frequency over time next to most frequent 1000 or so words in the corpus. We were then able to extract this data in tab separated value files, which we moved into Google Sheets to organize so that we could move it to Flourish for visualizations.
Extracting data from Google Ngram Viewer to compare
To be able to compare trends in the Carletonian to trends overall in the English language, we extracted data from the Google Ngram Viewer, which displays word frequencies from a number of available corpuses. The one we choose to use data from was English language books, published 1883-2019. To get the data for each particular word we wanted to analyze, in the URL we changed the word “graph” to “json”, which then displayed the frequencies of the word for each year. We then used a .json to .csv converter to put it in Google Sheets so that we could combine our Carletonian frequencies with the Google Ngram frequencies.
Visualizing textual and visual changes over time using Flourish, Time Graphs, and iMovie
Lastly, we used a few different methods to visualize textual, visual, and editorial themes in the Carletonian. For our wordcloud, line graphs, and line races, we used Flourish. For our timeline of name changes we used Time Graphs, and to create a flipthrough of front page layouts, we used iMovie.
